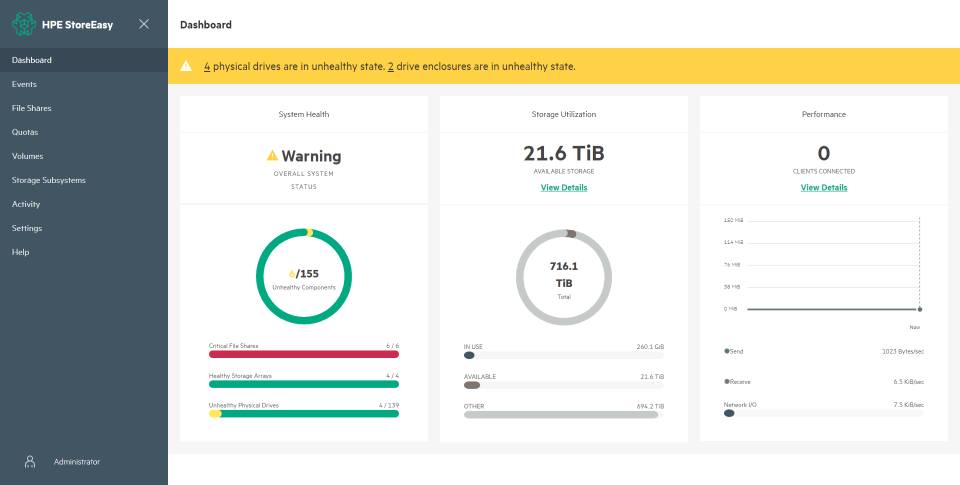
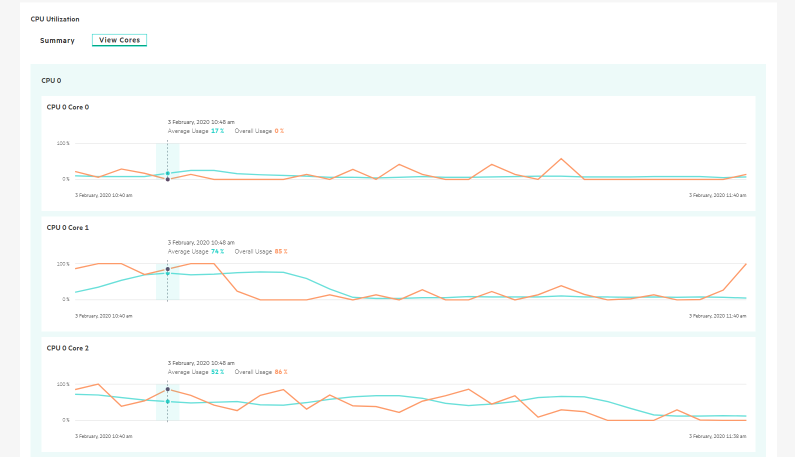
Dashboard of the HPE StoreEasy management console
The Dashboard provides a visual representation of the general health and capacity of the HPE StoreEasy 1000 Storage.
The dashboard metrics include:
General health status of all logical and physical components.
Overall CPU, memory, and storage utilization.
Current network utilization for read and write operations.
The Dashboard data is automatically updated every 30 seconds.

The notification banner displays the health status messages. If the state is either Warning or Critical, use the hyperlinks provided to drill down further to find the cause of the degraded or faulty states.
The following are the different status icons:
Green for OK (
 )
)
Red for critical (
 )
)
Yellow for warning (
 )
)
White for unknown (
 )
)
| Dashboard Components | Description |
|---|---|
| Health | Displays the health of the managed resources, such as file shares, arrays, and physical drives. To see the list for a specific resource or event, click the color-coded bar under that resource or select the resource or event from the left navigation pane. The following color coding is used to represent the health of the resources or the severity of the events:
|
| Storage Utilization | Displays the storage utilization and capacity trends for the following:
You can also view the storage utilization information in charts. You can move the slider bar on the chart:
Whenever there is a huge variation in the In Use, Available, and Other capacities, the total of these capacities may not be accurate or add up to 100%. Capacity shortage notification emails are sent when the threshold is reached. The historical data for storage utilization is also available. For more information about the historical data, see Setting the date range to display historical data. |
| Performance |
For more information about the historical data, see Setting the date range to display historical data. |
| View process data | It shows that the process data collected every 5 seconds. It displays the Process name, Windows Service or Application name, and CPU and Memory utilization at that instant. You can apply the time filters to adjust for the amount of data you want to view. By default, it shows data for 5 minutes. You can sort in descending order for CPU or Memory utilization to review data on which service or application is consuming most resources. |

