OpenFlow topology
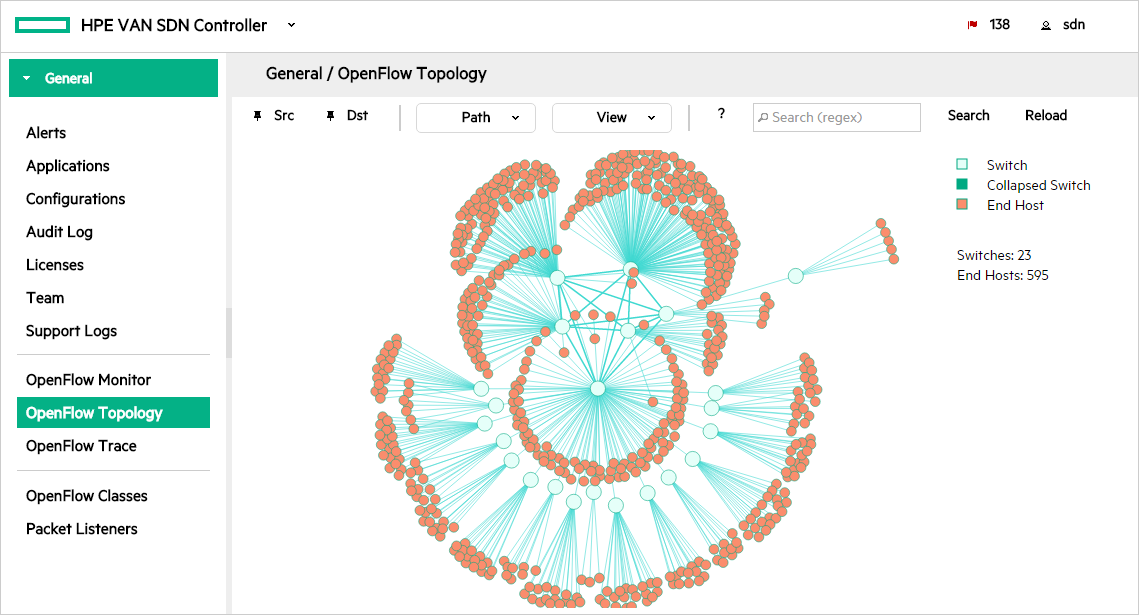
The OpenFlow Topology screen displays a topology of discovered switches and end nodes in the controller domain. You can view and change the graphical view of the network, as well as compute the broadcast tree to avoid loops and broadcast storms. The shortest path is computed using a Dijkstra graph search algorithm. The OpenFlow topology screen:
Displays a topology of discovered switches and end nodes.
Identifies the ports discovered on a given switch. Interface name and OpenFlow numbers are displayed
Identifies the shortest path between two nodes.
Provides node identification options (such as MAC or IP address label).
Provides a view of switch port identifiers, active flow rules, and a tool for testing flow rule options.
![[NOTE: ]](images/note.gif) | NOTE: In a topology where two or more controlled switches connect to the same uncontrolled switch, the controller will not learn the location of hosts directly connected to the uncontrolled switch. |
![[CAUTION: ]](images/caution.gif) | CAUTION: Do not configure a looped topology in the network between the OpenFlow and non-OpenFlow portions of your network unless you enable Spanning Tree Protocol on the non OpenFlow devices operating in the network. |
See also:
Displaying the network Topology
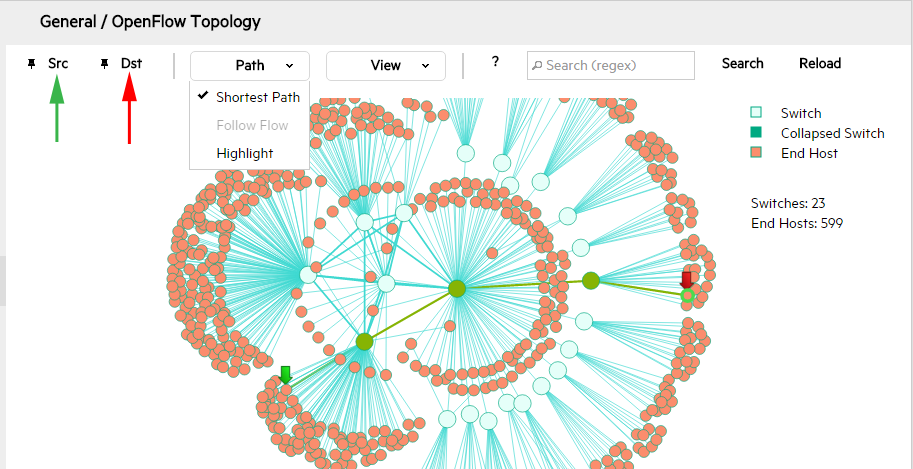
The OpenFlow Topology screen includes the switches and end-nodes in the controller domain.
The topology legend is show in the top right corner:
Switch — shown in light green
Collapsed Switch — shown in dark green
End Host — shown in orange
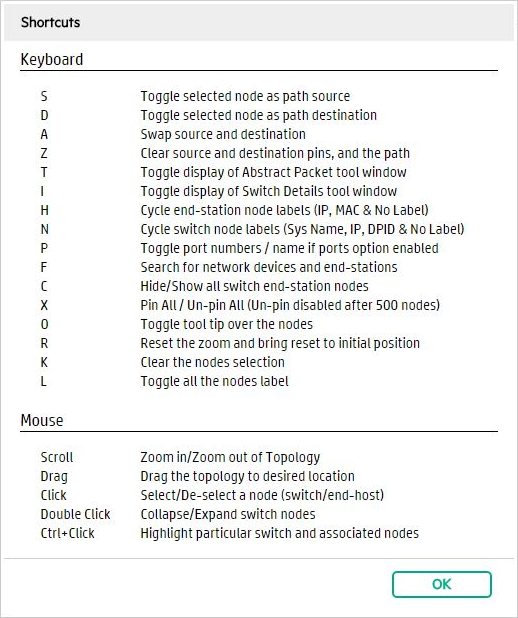
Using keyboard shortcuts to change the display
Use the ![]() icon to list the keyboard shortcuts
you can use to change the display.
icon to list the keyboard shortcuts
you can use to change the display.
To use the keyboard shortcut keys you must first click somewhere in the topology view to bring it into focus and then you can select a shortcut key. An outline around the topology indicates it is in focus.
See also:
Changing switch and host node labeling
You can change how nodes are labeled in the topology using keyboard shortcuts.
To turn on or off ALL node labels, enter the keyboard shortcut L.
To change the host node labeling in the topology, enter the keyboard shortcut H and the display will cycle through the different node labels each time you enter H.
Host end-nodes can be labelled with one of the following:
IP Address(default)MAC AddressNo Label
To change the switch node labeling in the topology, enter the keyboard shortcut N and the display will cycle through the different switch labels each time you enter N.
Switches can be labelled with one of the following:
System name(default, if the switch does not contain a system name then IP address is shown instead)IP addressDatapathIdNo label
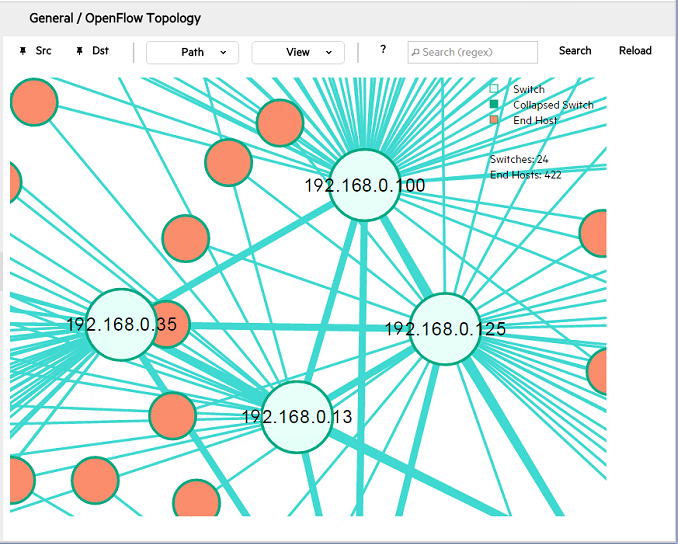
For example, to change the default display showing System name labels to show the IP addresses of the switch nodes, click anywhere in the topology display, then press N. The switch IP addresses appear as labels in the topology diagram:
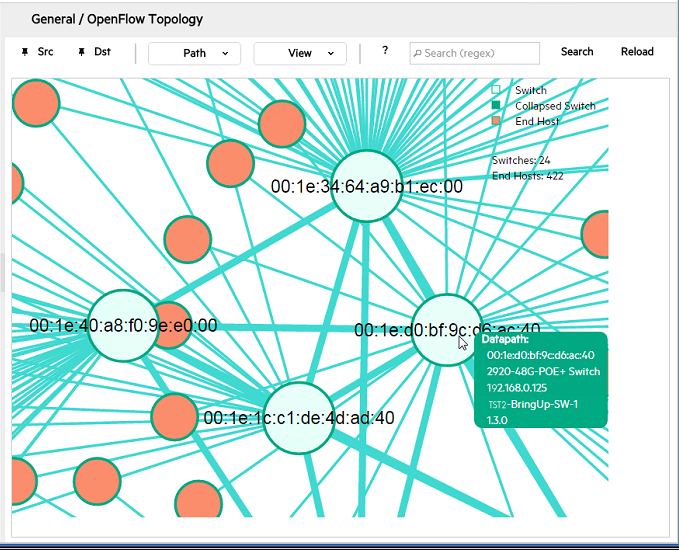
Press N again to display the switch datapath IDs as labels in the topology diagram:
Press N again to display the unlabeled switch view.
And press N again to return to the System Name switch labels.
Using the mouse to change the topology display
Zoom in or out in the topology by using the scroll wheel on the mouse.
To drag the topology to a desired location, place the cursor in the topology and hold the mouse button down while dragging to move the topology.
Select or deselect a switch or end-node host by clicking the node.
Changing the topology display using the View menu
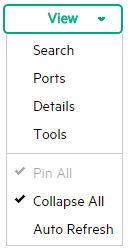
You can use the View menu to change the topology display.
See also:
Using Search
You can search the topology based on various criteria by using one of the following methods.
Search using View → Search. Or press the F shortcut key to open the Search dialog box. This search is based on any ONE of the following criteria: Switch IP, Datapath ID, Host IP or Host MAC.
Type the search criteria in Search (regex) box and click Search. This search is across ALL the text including: Switch IP address, Datapath ID, System name, End host IP address and MAC address.
Search using the Search menu:
Select View → Search. Or press the F shortcut key to open the Search dialog box.
The Search dialog box is displayed.
When the Search dialog box is opened, if one or more nodes are collapsed or highlight path is enabled, all will be cleared during the search. After the search dialog is closed, the state of collapse and highlighting will be returned.
From the drop down list, select one of the search criteria: Switch IP, Datapath ID, Host IP, Host MAC. Then enter the search value.
Click Search. If any match is found the border changes to green. If no match is found the border changes to red.
To close the dialog box click Close or click Reset to clear the search value and reset the topology view.
Search using Search (regex):
Enter the value you want to search on in the Search(regex) field located in the top right of the topology view. You can enter a regular expression for more complex searches.
For an exact match, $ should be appended at the end. For example, if there are IP addresses like 10.10.10.10, 10.10.10.100, 10.10.10.101, 10.10.10.102, etc. and if you want to search for only 10.10.10.10, you should put the search string as 10.10.10.10$.
Click Search or press Enter.
Viewing port labels on switches
You can view port labels on the links between switches and between switches and end nodes. Port labels can be interface name or OpenFlow numbers.
Select View → Ports to display port labels on switches. Press the P shortcut key to toggle between displaying OpenFlow port number or port name. Toggling only works when the Ports menu option is selected.
Viewing details
You can view details for a switch by selecting View → Details. For more information, see Viewing flow details for selected nodes.
Using tools
After specifying a source and destination data flow you can view details on the packet selection criteria by selecting View → Tools. For more information, see Viewing details on packet selection criteria for a data flow.
Using pin, Collapse All, Auto Refresh and Reload
Pin
To pin or unpin the switches and end nodes, press X or select View → Pin All.
When you enable Pin All nodes and Auto Refresh, if any topology updates occur (such as an end host moved or was removed), then Pin All is automatically removed to update the topology and then once the topology is updated, the topology is pinned back. However if you had any customized view then that may be changed during that time. If the number of nodes increases by more than 500 (both switch and end hosts), Pin All will be enabled and disabled automatically. Once node count comes down to less than 500, Pin All will be re-enabled.
Collapse All
Collapse the topology display to show only the number of end nodes connected to each switch, instead of showing all end nodes (the default) which can present a cluttered display where a large number of end nodes are connected to the OpenFlow switches. To collapse or expand end-nodes for a particular switch, double-click the selected switch.
To collapse all end nodes, select View → Collapse All.
Auto Refresh
To automatically refresh the topology, select View → Auto Refresh.
Reload
To reload the whole topology, click the Reload button in the top right of the topology view. When the topology is reloaded, Highlight, collapse, Collapse All, selection, and node labels will be reset.
Viewing the shortest path between two nodes
You can view the shortest path between two nodes as follows:
Select the source node and click Src or press S.
Select the destination node and click Dst or press D.
The controller displays the path between the two nodes as a line, see Locating the shortest path between two nodes ).
Features like Collapse all, collapse a single node and highlight a particular node using Ctrl click are not allowed when a path is selected.
To exchange source and destination nodes, press A.
To clear the source and destination flags as well as clearing the path, press Z.
Follow Flow
The Follow Flow option
is enabled only when the controller is in pure OpenFow mode, where hybrid.mode is
set to false. The Follow
Flow option is disabled when the controller is in hybrid
mode.
When the controller is in pure OpenFlow mode, select Path → Follow Flow.
Highlight flow
The Highlight option is enabled only when a path is selected (either Shortest Path or in Follow Flow mode). Highlight path is cleared when you toggle between Shortest Path or Follow Flow. For example, with Shortest Path is enabled you select Highlight path, then you select Follow Flow, the Highlight path will be cleared and you have to select Highlight path again for Follow Flow.
Select Path → Highlight.
Viewing flow details for selected nodes
The Switch Details window displays flow details.
Select a switch node and then select View → Details or press I to display the Switch Details screen.
Viewing details on packet selection criteria for a data flow
For a source-destination data flow you can view details on the packet selection criteria used.
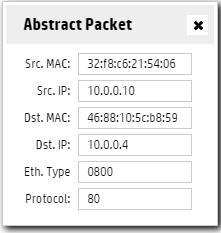
Select View → Tools to display the Packet Selection dialog box or press T. The display is read only.
The Abstract Packet window displays selection criteria for packets moving between the Source-Destination node pair. MAC addresses and IP addresses are shown based on the source and destination nodes selected.
