Viewing your team configuration using the UI
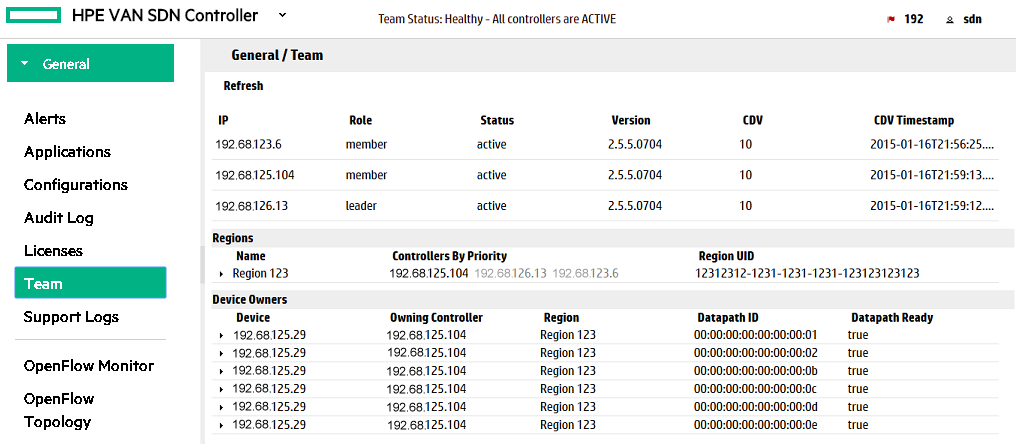
You can view your team and region configuration from the SDN Controller UI’s Team screen. To access the Team screen, click Team in the controller UI navigation pane. The Team screen is read-only and includes:
Team status (top banner)
Team configuration and controller status (top section)
Region configuration (middle section)
Device Owners (bottom section)
Viewing team status
You can view your team status from the top banner of the controller UIscreen. The team status indicator refreshes dynamically to immediately notify you of important team status changes, such as when a 3-node team changes to a 2-node team.
The team status banner displays one of the following team status messages:
ACTIVE
All 3 controllers are actively operating (for example, all controllers are able to communicate with each other) so a healthy team status message is displayed:

UNREACHABLE
Any single controller of a team is not able to communicate with the rest of the team members so a degraded status massage is displayed:

Unreachable status occurs for either of the following reasons:
The
sdncservice stopped working or a controller has been rebooted.A network partition occurred and a controller in a team has become separated from the other team members.
UNKNOWN
A team status cannot be determined and an unknown team status message is displayed:

Unknown status occurs for either of the following reasons:
A communication failure with a REST service component occurred.
A network failure caused the controller to be suspended.
Viewing team configuration and controller status
From the Team screen, the team configuration and controller status (top section) displays the following fields:
IP: IP address of the controller.
Role: Member or leader. A team can only have one leader and at most 3 controllers.
Status: The status for each controller in the team, which can be one of the following (for details see Controller status ):
initializingactivesuspendedunreachable
Version: The build version of the controller software running on the controller.
CDV: Core data version. This field is incremented every time the controller experiences a change in configuration. This field is used to determine which controller to synchronize with when a controller joins a cluster.
CDV Timestamp: Date and time at which the controller experienced its last change in configuration.
Viewing region configuration
From the Team screen, the region configuration (middle section) displays the following fields:
Name: Name of the region.
Controller by Priority: First controller (in bold) is the master controller for the region. The master controller handles the flows and packet-ins. The following controllers (grayed out) are slaves. If the highest priority controller is unavailable, HA fails-over to the next highest priority device in the region configuration for that device.
Region UID: Identifies a region; used by certain REST API commands.
To view a region’s details, select the desired
region. In this example, Region123 is selected:

The region’s details include the following fields:
Ranges: The configured ranges (IP ranges).
Devices: List of IP addresses one-by-one.
One of these must be present, or both may be used.
Viewing devices, datapaths, and debug logs
The Device Owners portion of the Team screen (bottom section) displays the following fields:
Device: The device IP.
Owner Controller: The controller that is considered the current owner of the device (for example, the configured OpenFlow master).
Region: The region that the device belongs to.
Datapath ID: Datapath identifier for the device. A device can have multiple datapaths.
Datapath ready: Default flows have been pushed.
To view a device’s debug log for support purposes,
select the desired device. In this example, the debug log for device 12.255.125.29 is
shown:

